Role: Head of Design — UX strategy, research, design system
Team: 2 designers, 4 engineers
Dates: 2014–2026
Platform: Web and Android
Outcome: 220M+ submissions, 580K+ forms, deployed enterprise-wide across UN agencies and global humanitarian partners
Team: 2 designers, 4 engineers
Dates: 2014–2026
Platform: Web and Android
Outcome: 220M+ submissions, 580K+ forms, deployed enterprise-wide across UN agencies and global humanitarian partners
The problem
Ona's customers were NGOs and UN agencies running field surveys and long-running data programs. The people entering data were frontline staff, not analysts. The people who needed the data were three time zones away and needed it to be trustworthy. The platform had to carry sign-up, onboarding, collection, permissions, and cross-team data management for both user groups.
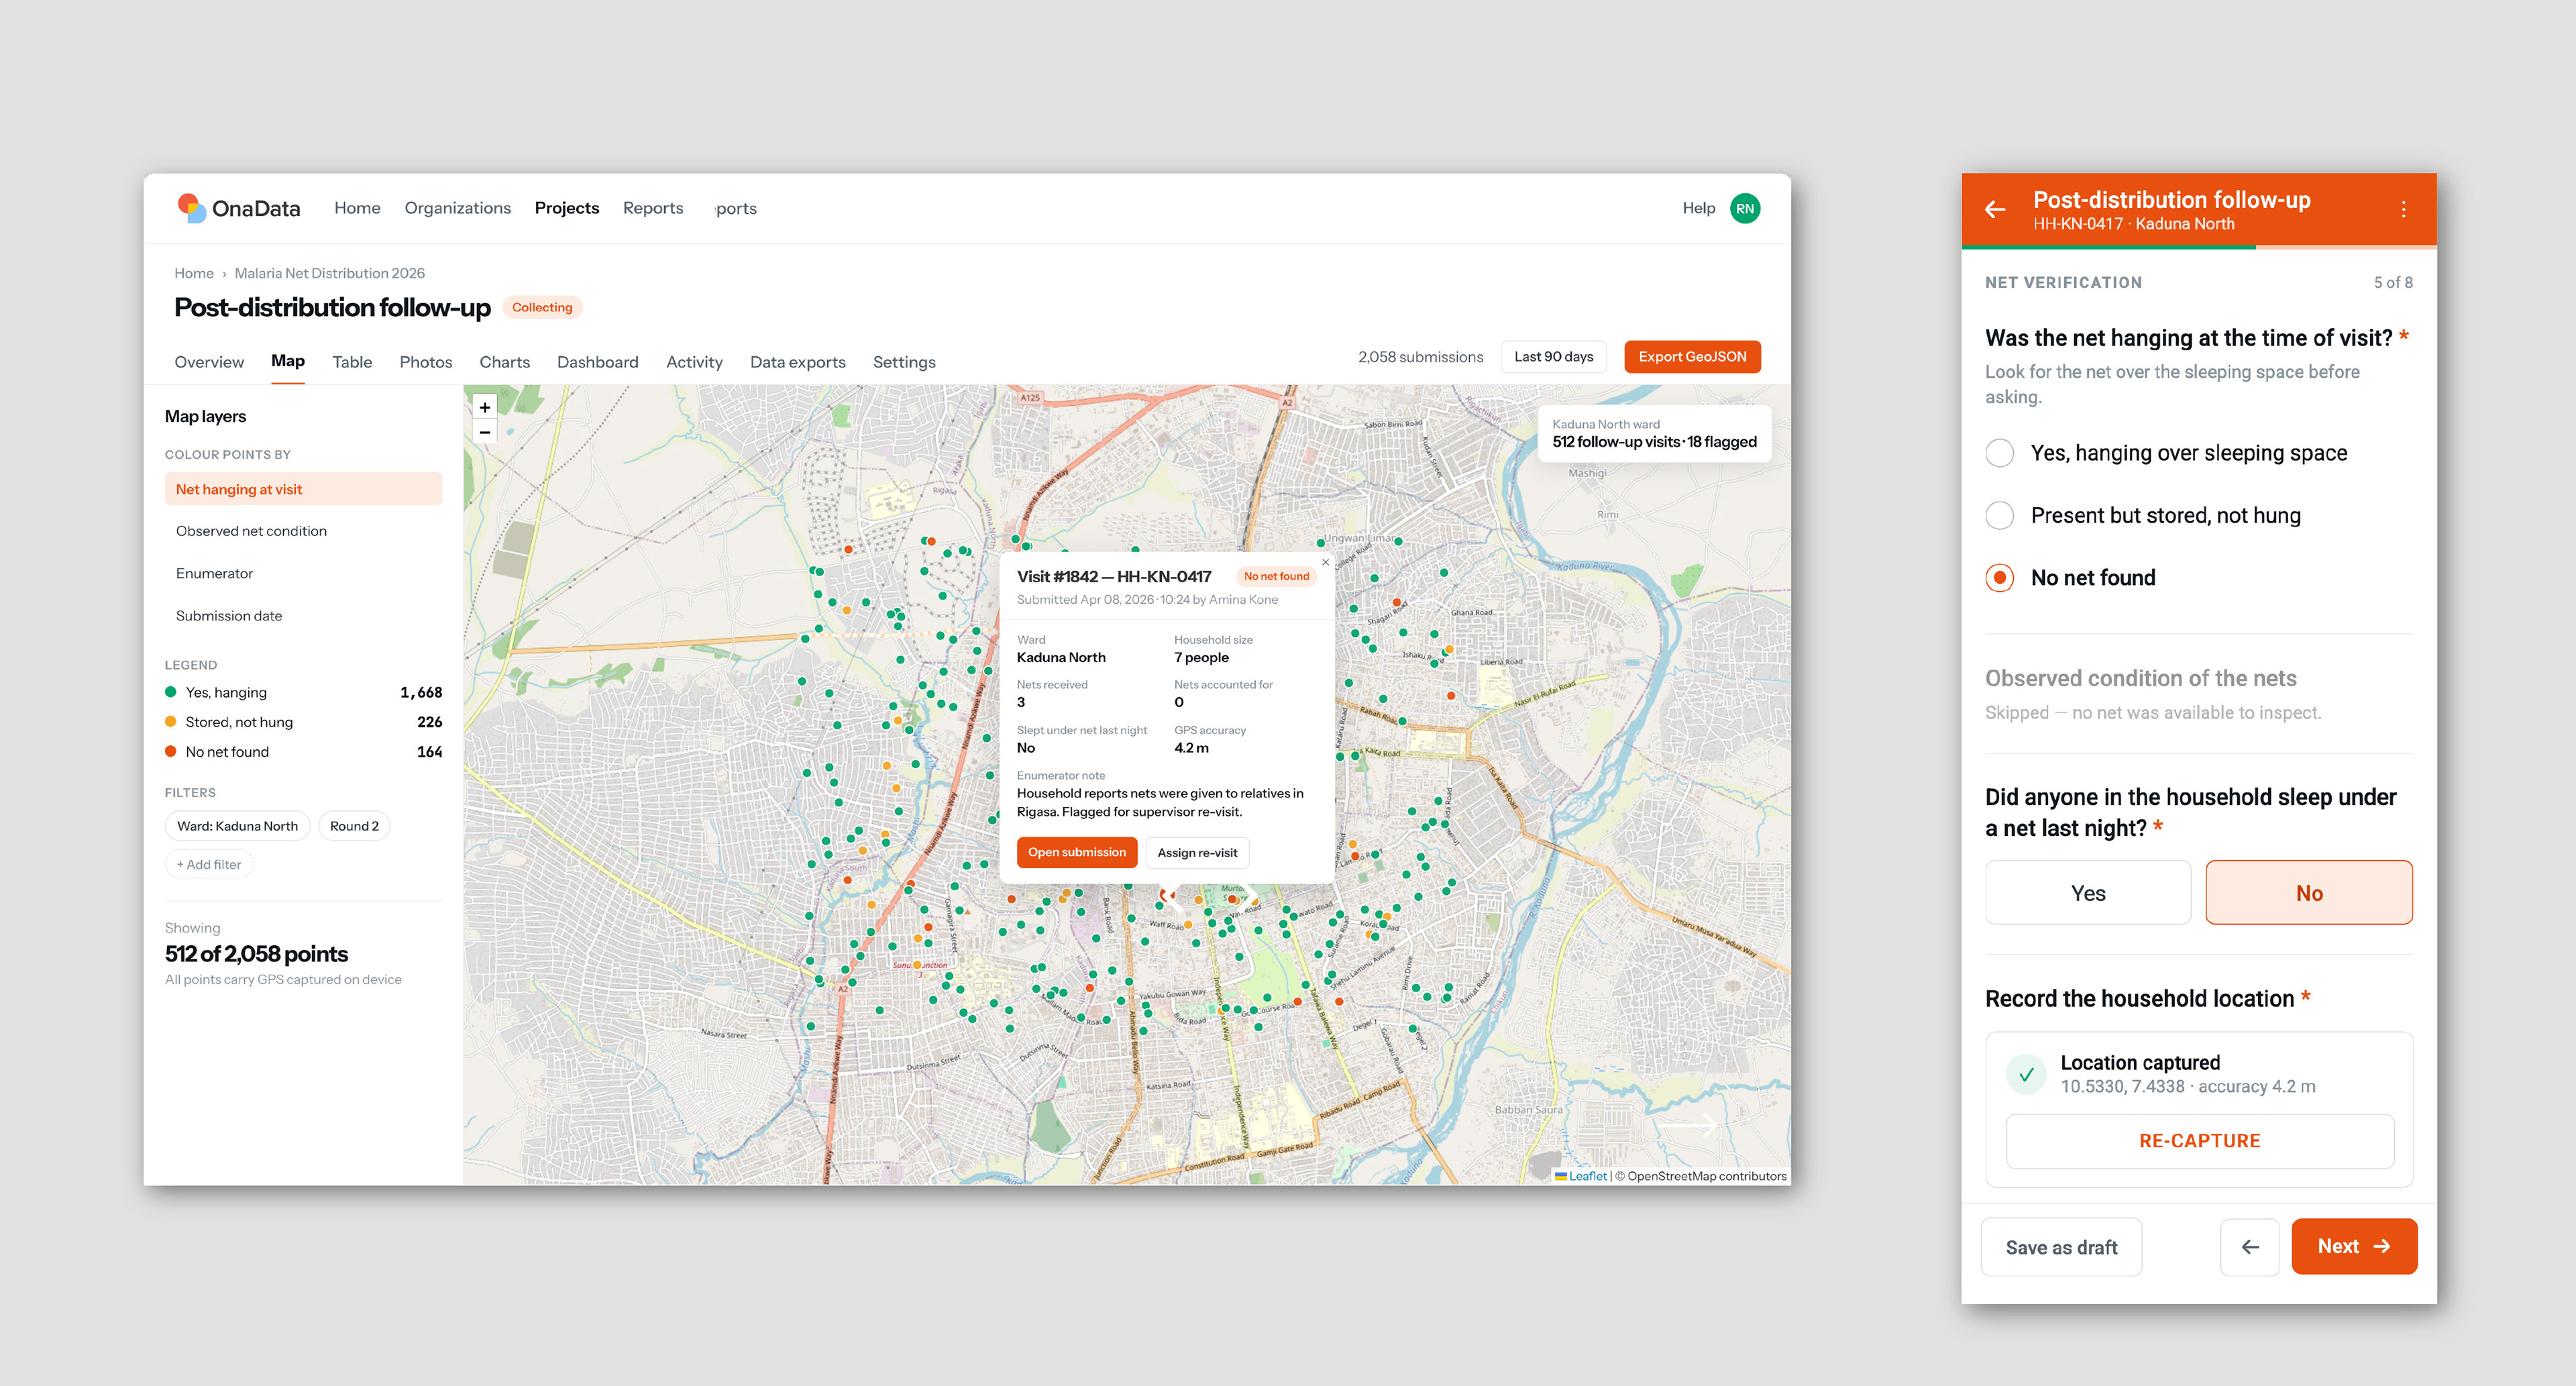

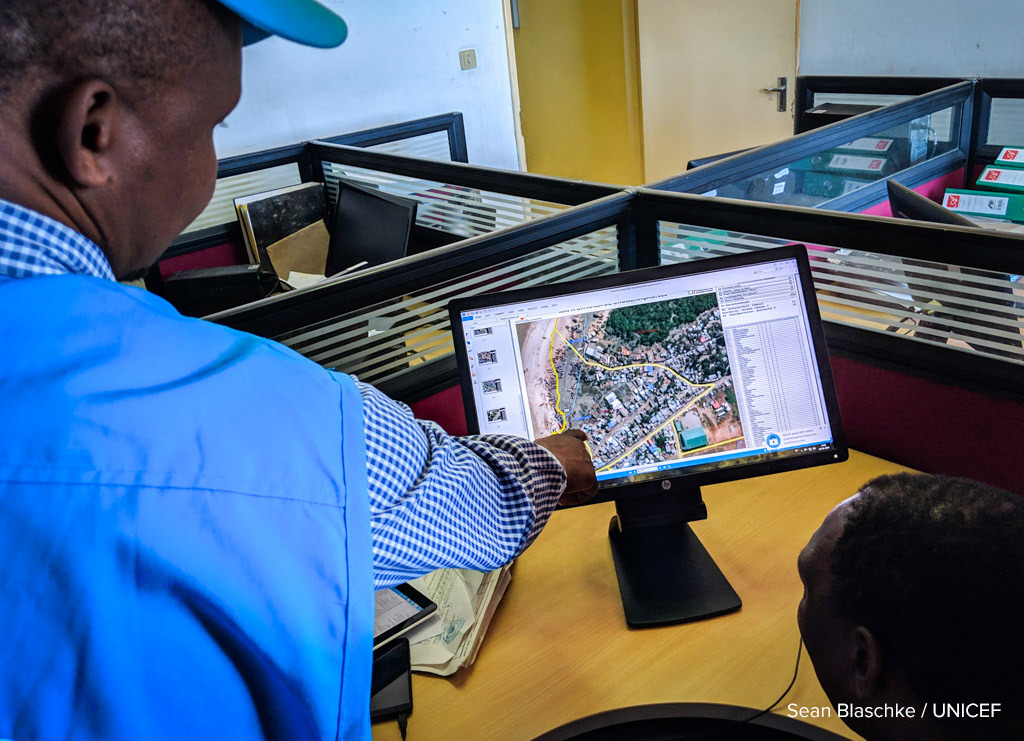
Ona Data is a mobile and web-based data collection and visualization platform. It is primary used by organizations to build digital forms and gather field data offline on Android devices or tablet and mobile web browsers. When reconnected, data automatically syncs to the website where it is available to analyze using maps or charts, export as structured data, or connect to data tools using an API.
Grounding the roadmap in real usage
I owned UX strategy end to end, from research through wireframes, prototypes, and engineering hand-off. To keep the roadmap out of anecdote territory, I ran client interviews and a user survey that reached day-to-day users across roughly 40 country offices, then built a process for sorting that feedback into structured product groupings we could prioritize against.
The same themes kept surfacing: security and access control, form management, enterprise permissions, PowerBI integration, UI customization. Permissions came back flagged high-priority again and again, which is what pushed it to the front of the roadmap.
I validated with paying customers before we committed engineering time. Rapid prototyping, usability testing, and field visits let us de-risk the workflow and permissions models before they were built, which is where the expensive rework usually happens.
Retention
Research showed our churn risk wasn't cancellation. Customers drifted quietly between projects and never came back. That reframed the whole problem: the signal to watch was project repeat rate, not logins or seat count.
I built a retention strategy around it — lifecycle phases, account health metrics, and separate tactics for enterprise and SMB customers, including a gap-period email sequence and a structured enterprise check-in.


Early Ona Data strategy sessions
Key design challenges
Building forms without writing code
Ona Data's most powerful feature is also its most complex: forms are authored as XLSForms, using a spreadsheet to define fields, labels, choice lists, form logic, and variable names. It was a foundational technical requirement we could not build around for our use cases, so we had to find a way to prevent errors. We created a wizard-style flow that verifies the spreadsheet on the way in and lets a user preview and check the resulting form before it goes live. This helped non-technical program managers feel more confident in their work.
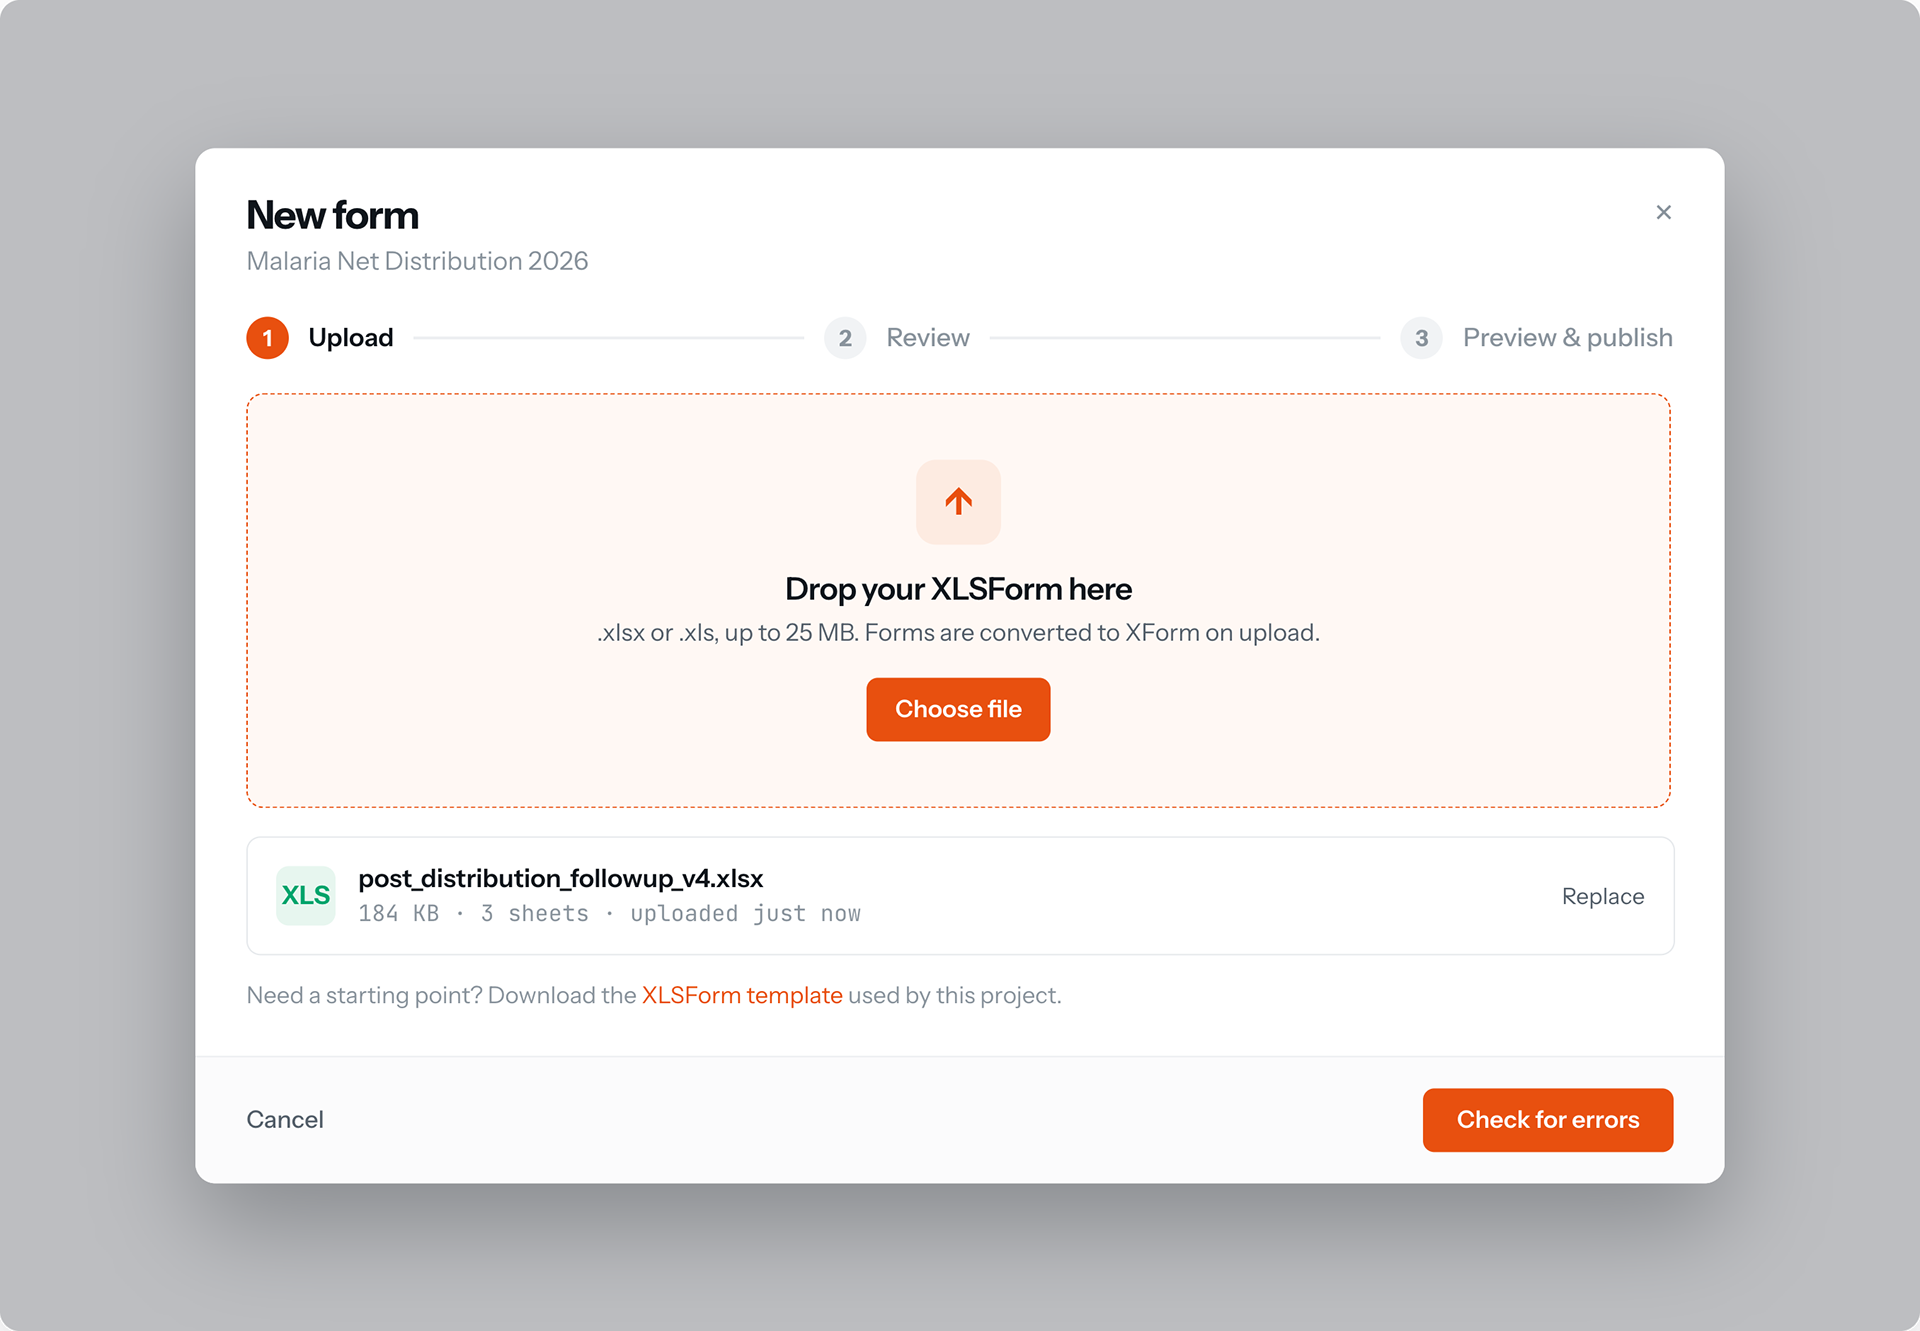
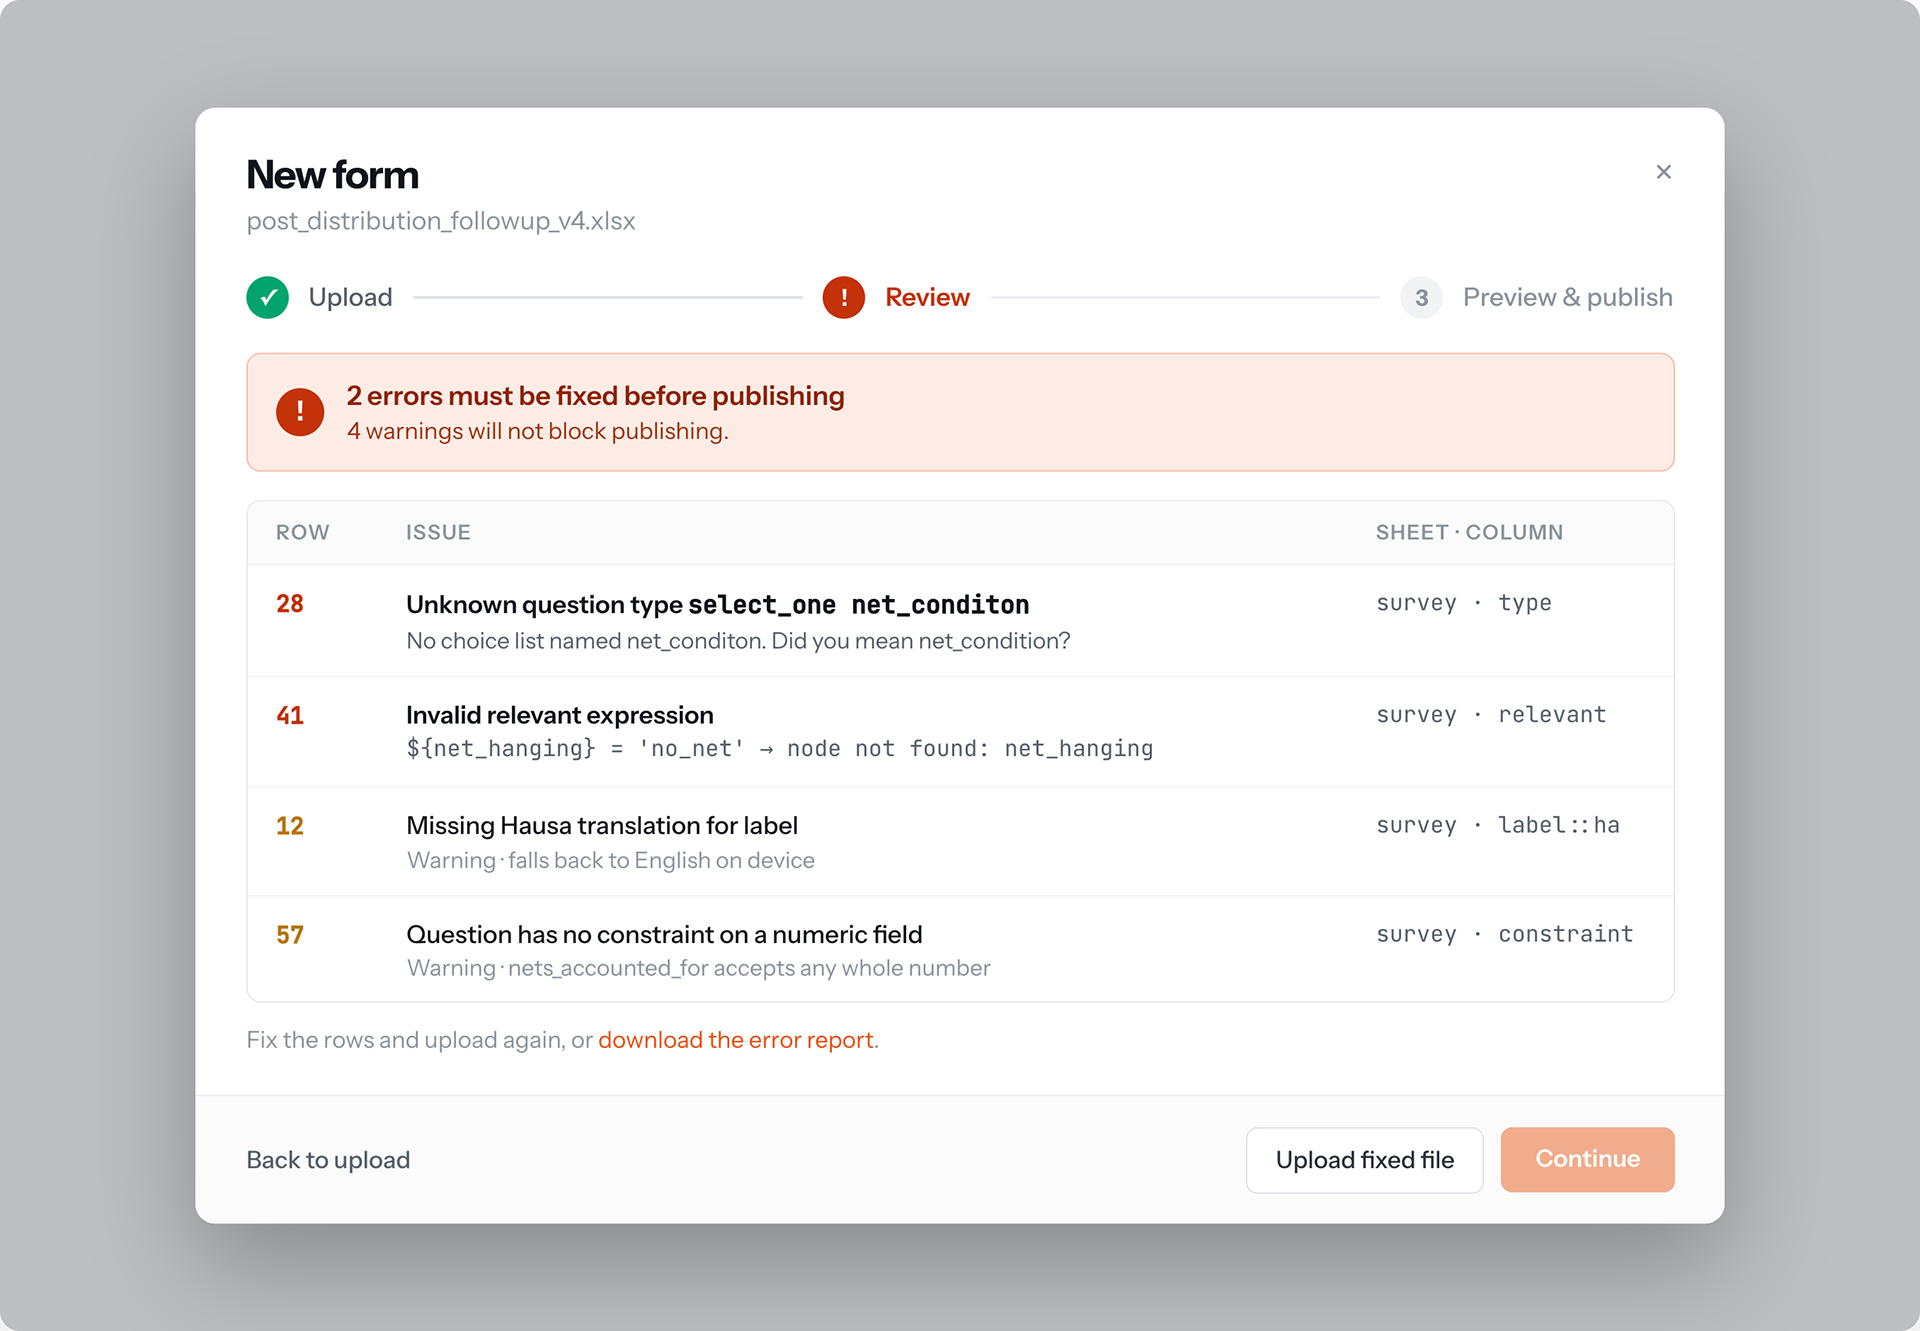
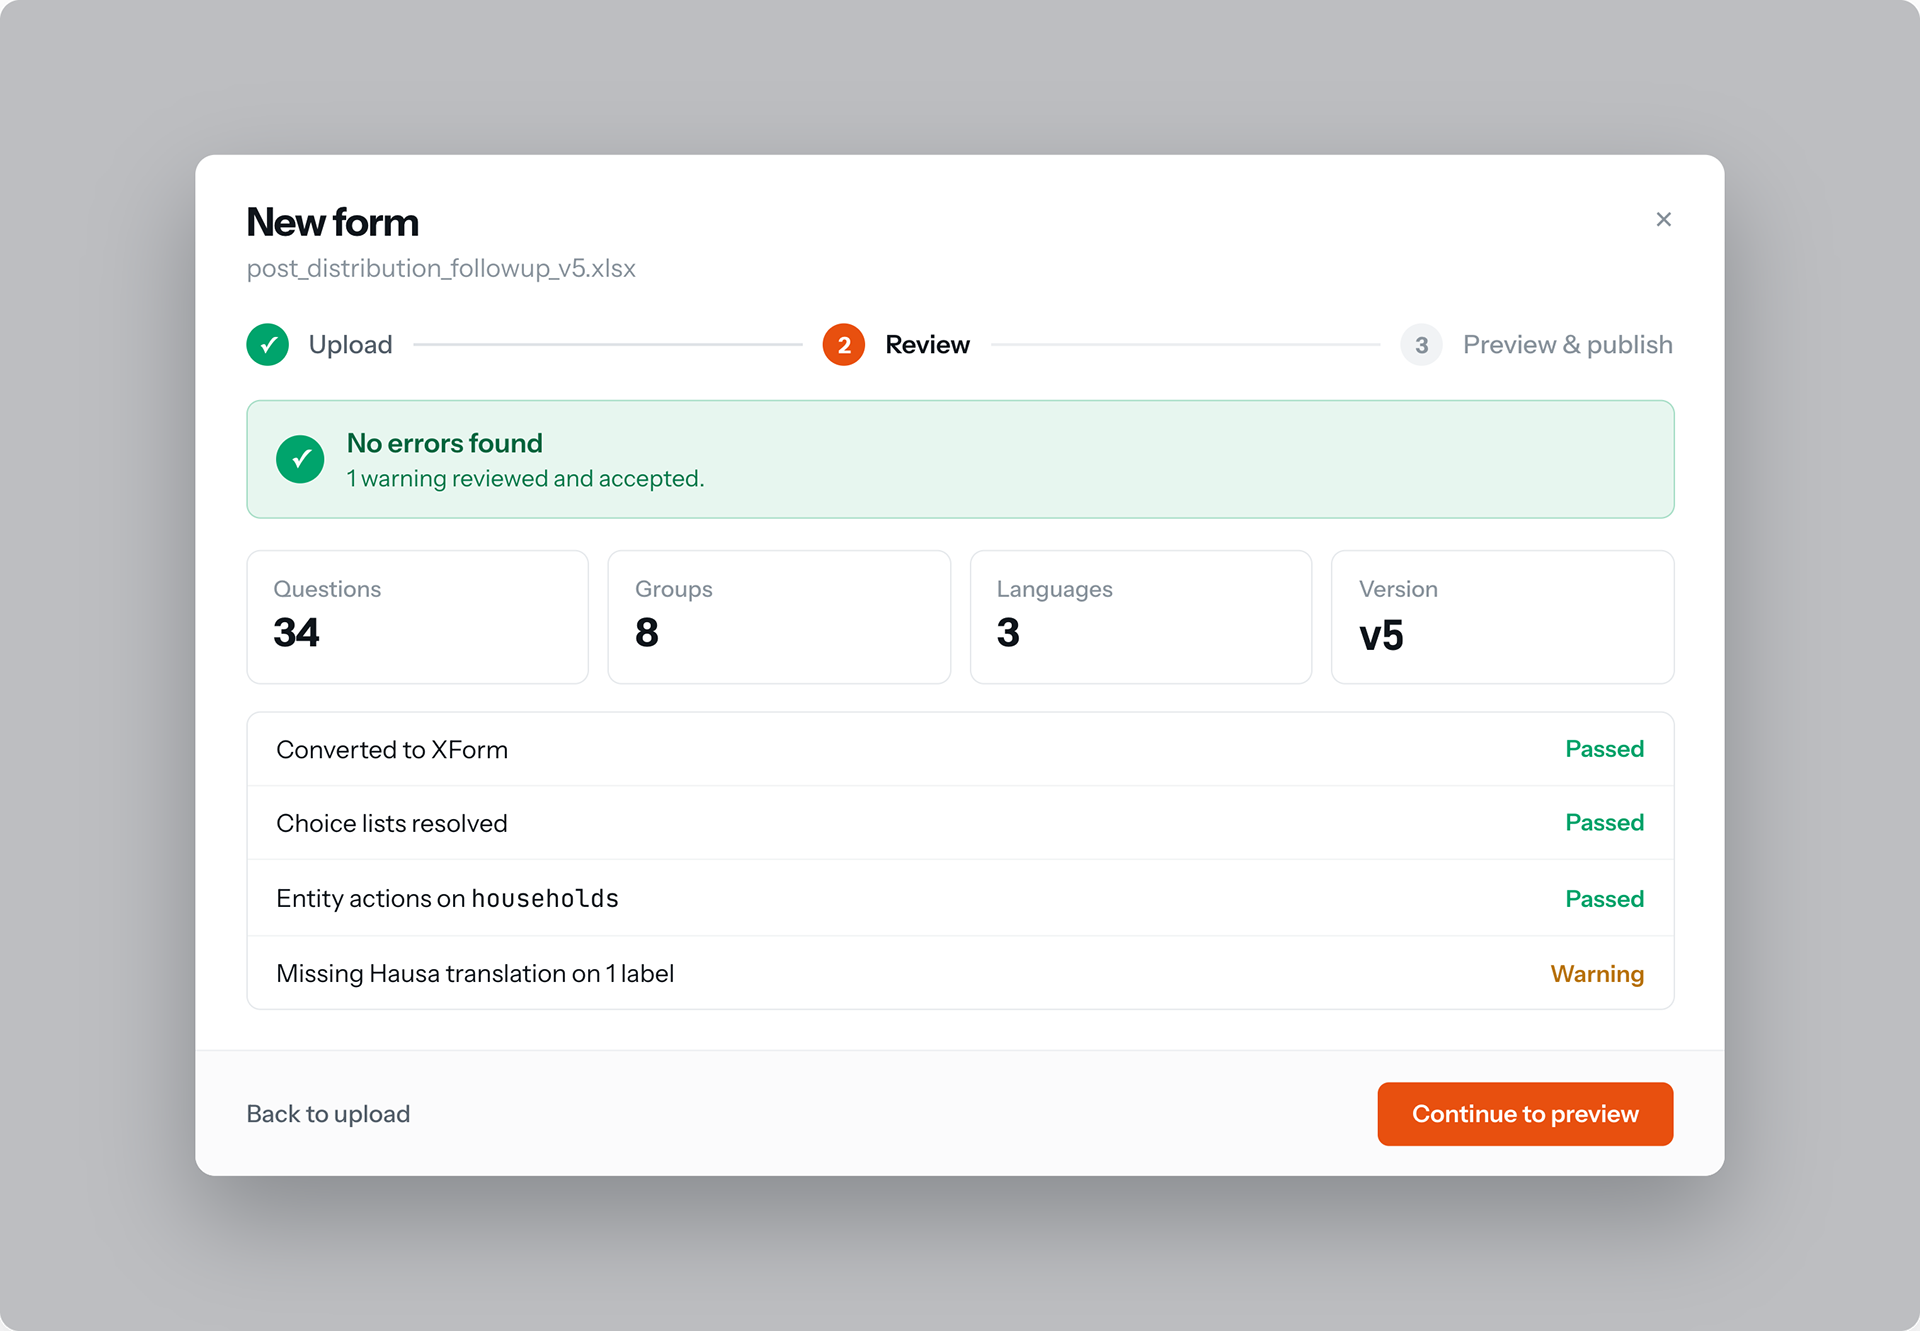
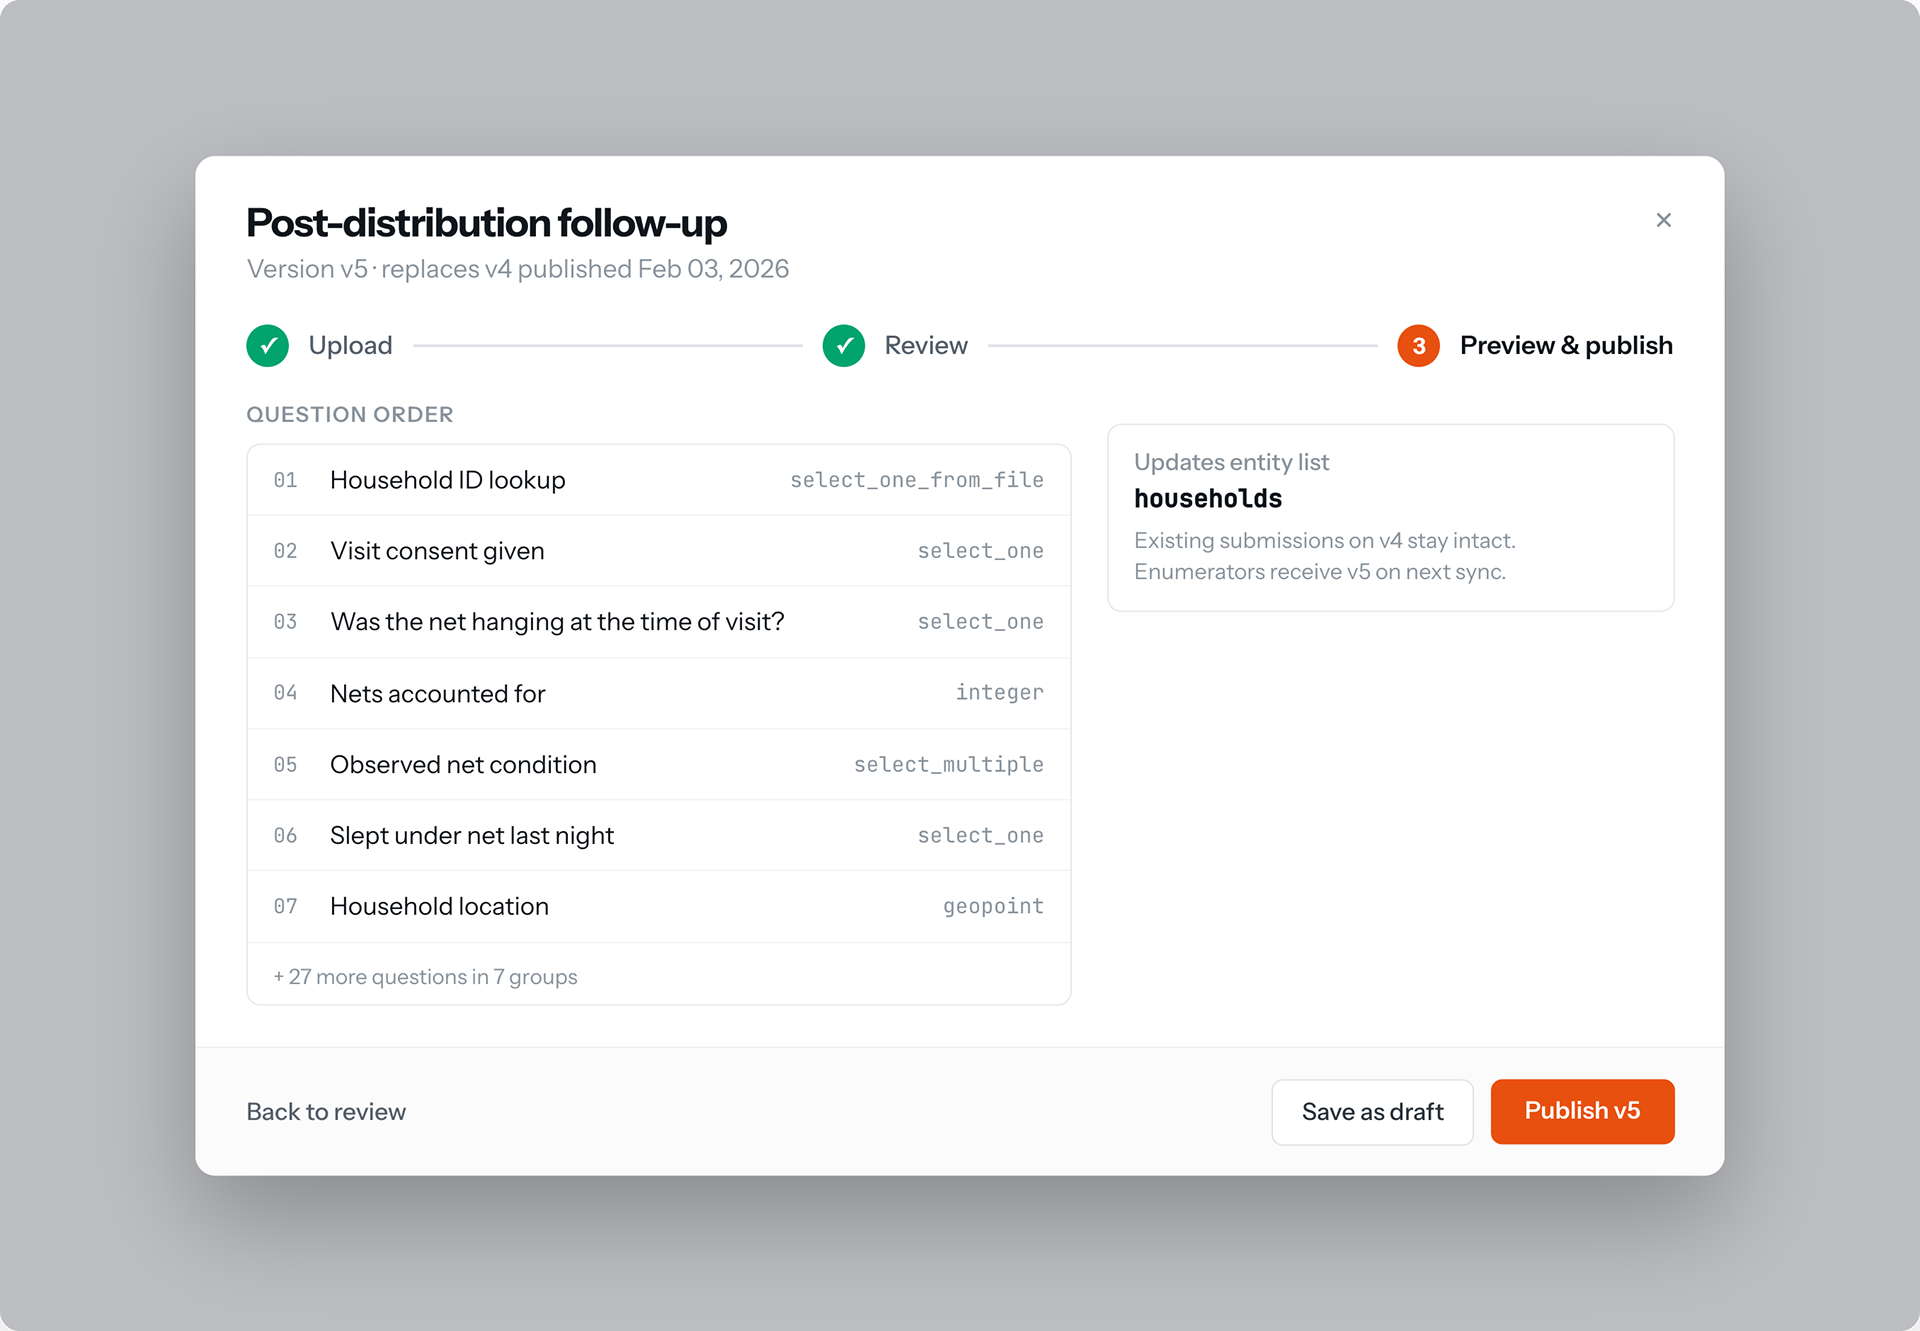
Key steps in the add form wizard
Permission levels
Permissions were the flow we spent the most time on, and the one I'd still call unfinished. The hard part is that the same permission model has to work for a small team of a few users and for an enterprise account managing thousands, and those are genuinely different problems. What we landed on works well for the large majority of users, but scaling it cleanly to very large enterprise accounts is something we kept iterating on rather than something we ever fully solved.
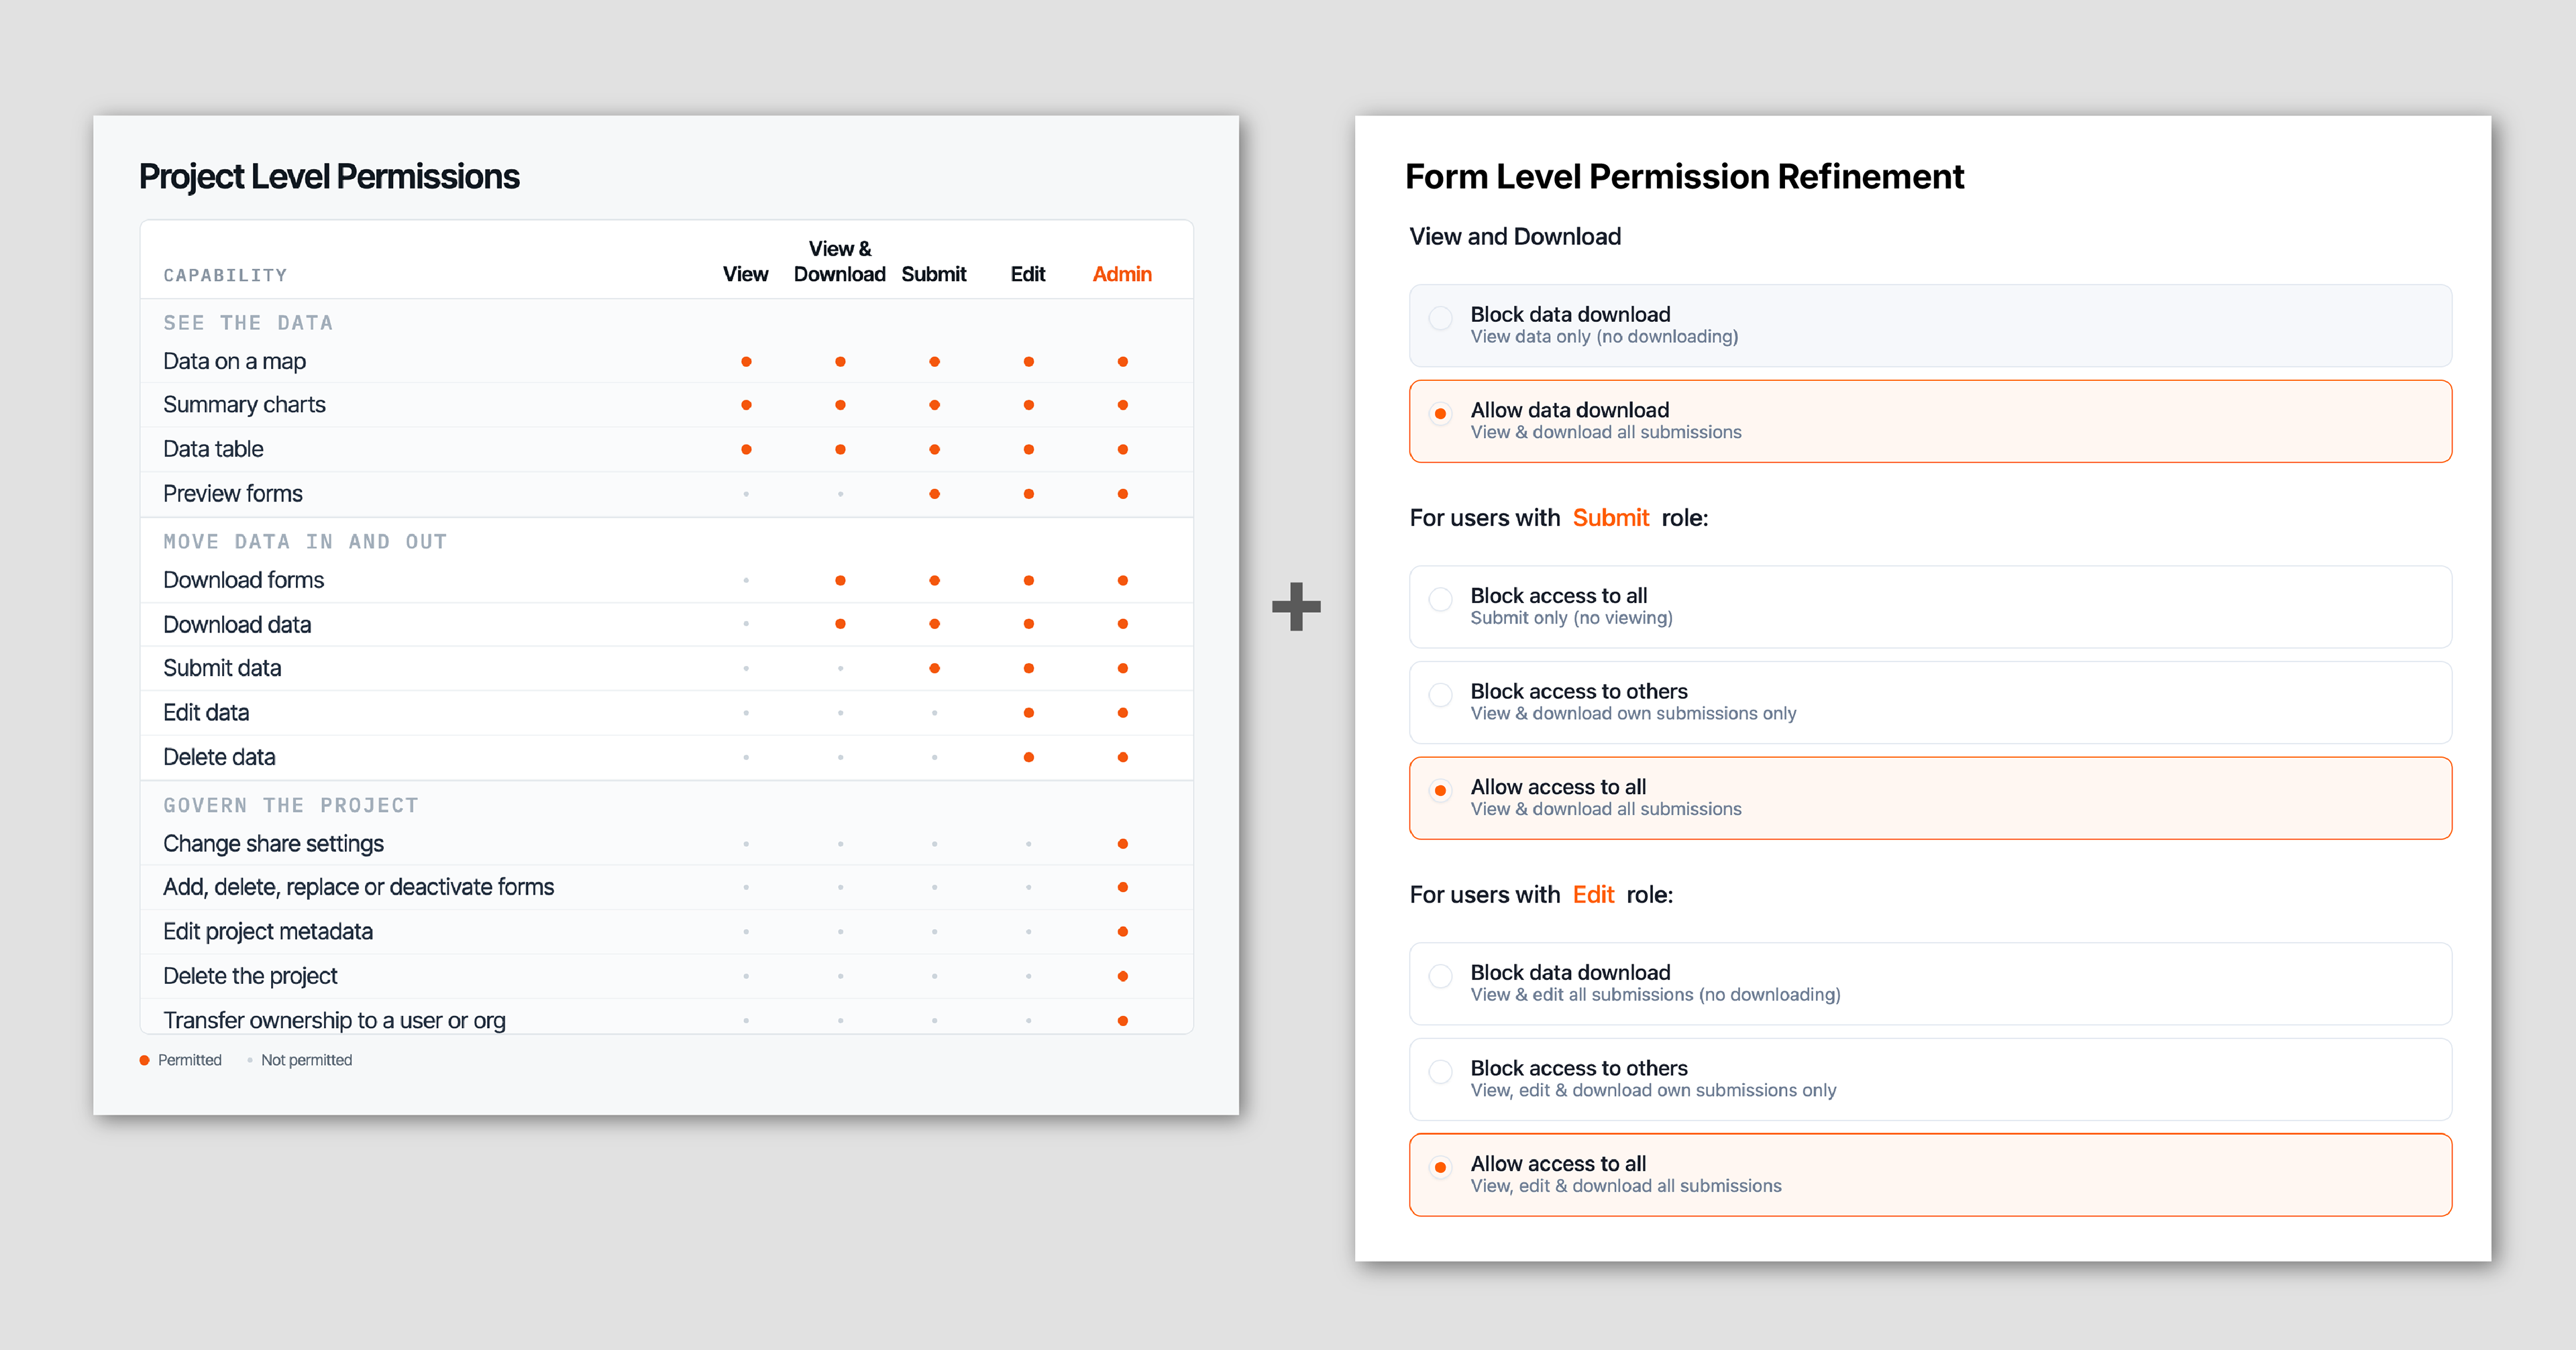
We initially introduced project-level permissions that passed to all forms in the project. Enterprise users needed more granular permissions, so we worked closely with them to define additional form-level controls.
Form data view
Given how varied the underlying data could be, a single data view was never going to satisfy everyone, and we didn't have the resourcing to build a custom view for every use case. We built one solid default view that covered the common cases, then gave power users a path out through specialized exports and APIs that pushed data into tools like Power BI and Tableau.
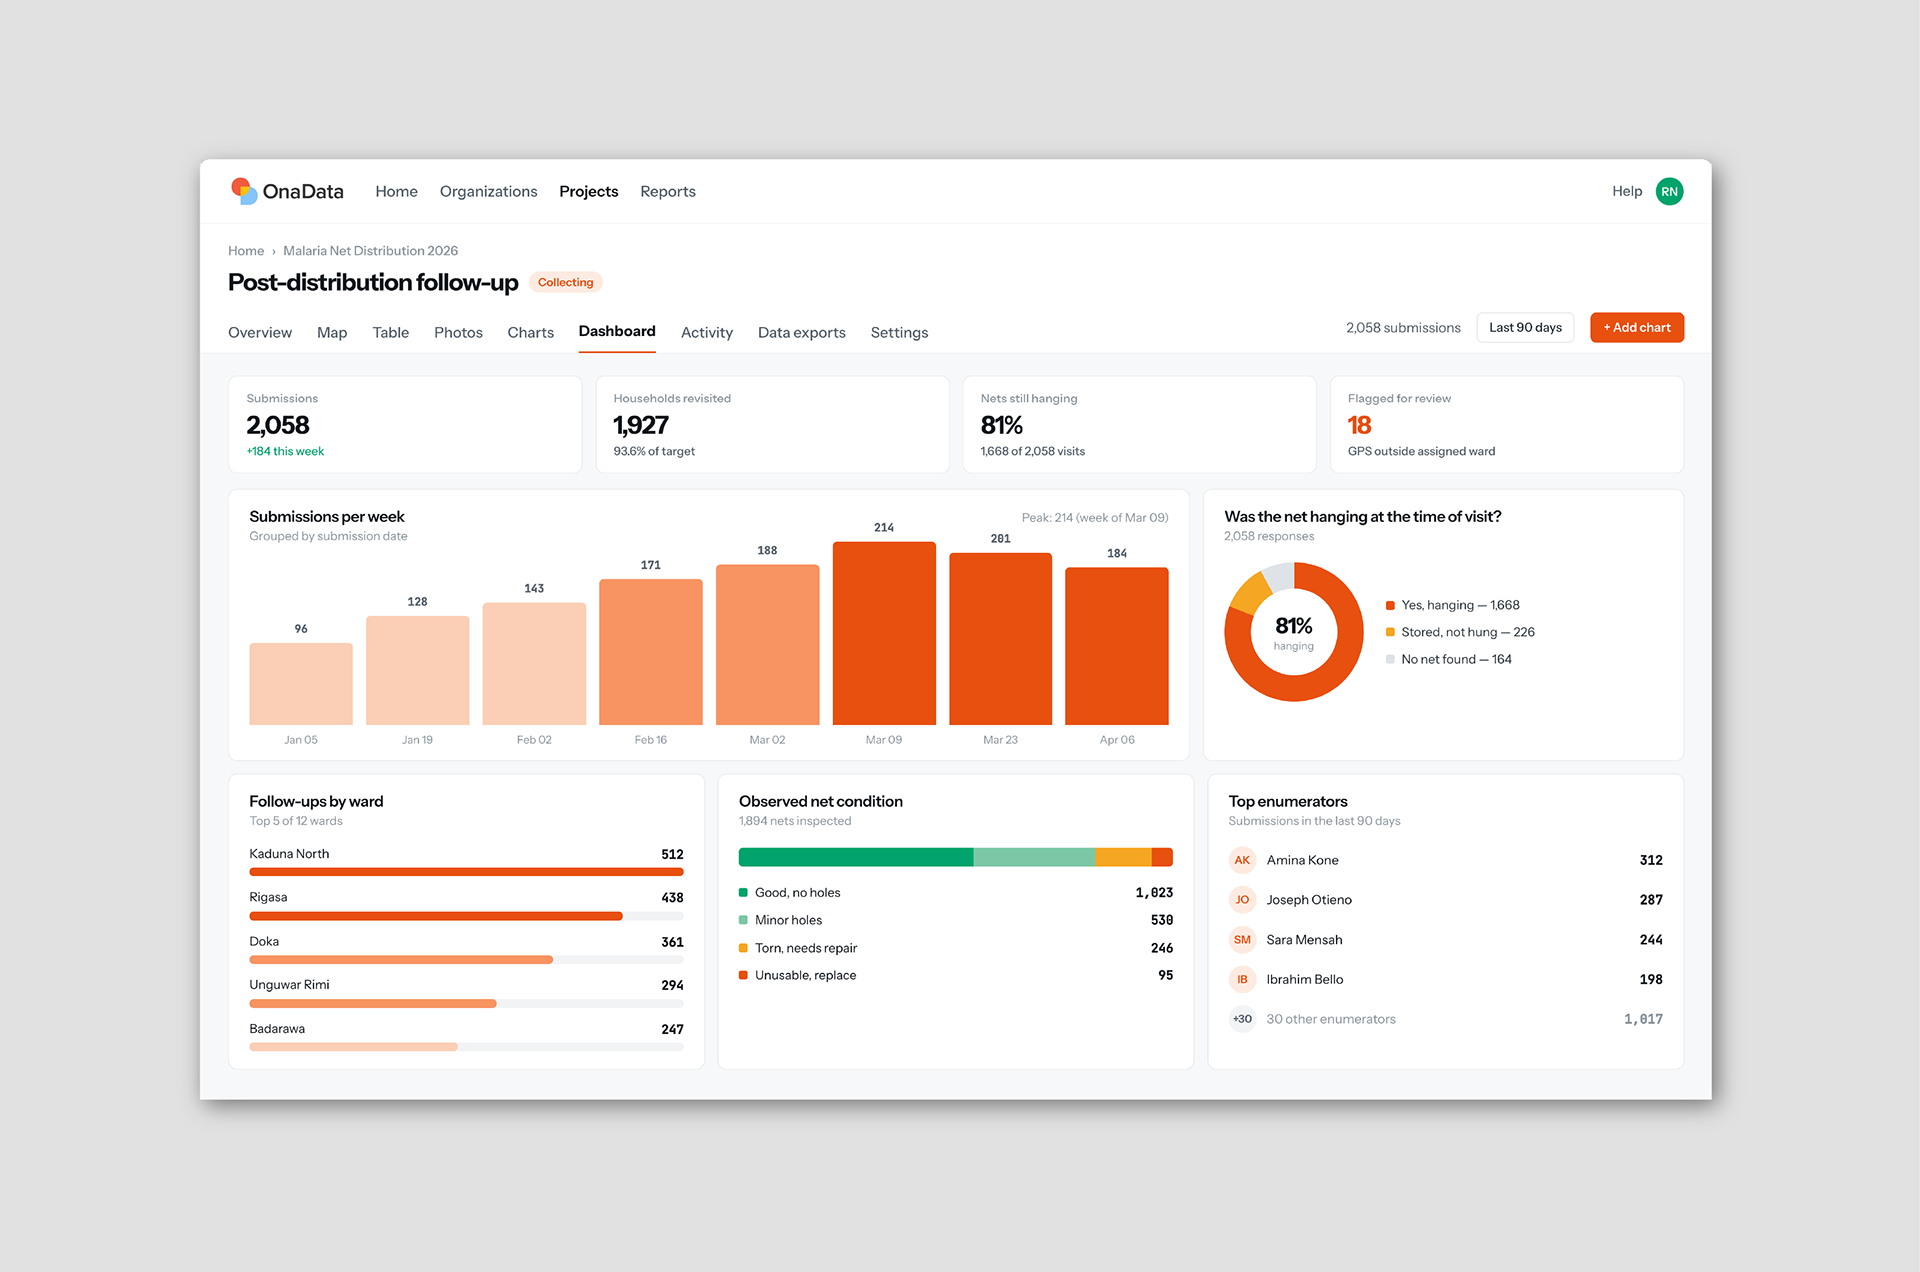
We found through surveys that most organizations employ data analysts and have existing data visualization tools at an organization level, so we chose to offer just enough functionality in the form activity view to help real-time tracking during live data collection and light data analysis.
Activity view
The activity view needed to show a detailed record of anything that touched the data, but a literal line-by-line log of every action would have been unusable. We scoped it by asking what people actually came to this view to do — mainly catching destructive actions like deleted or edited submissions, and seeing who had access to what — and designed around those two jobs rather than trying to represent everything. We also grouped related activity instead of listing every event individually. It launched at the form level first and got a strong response; users have since been asking for the same view at the account and project levels.
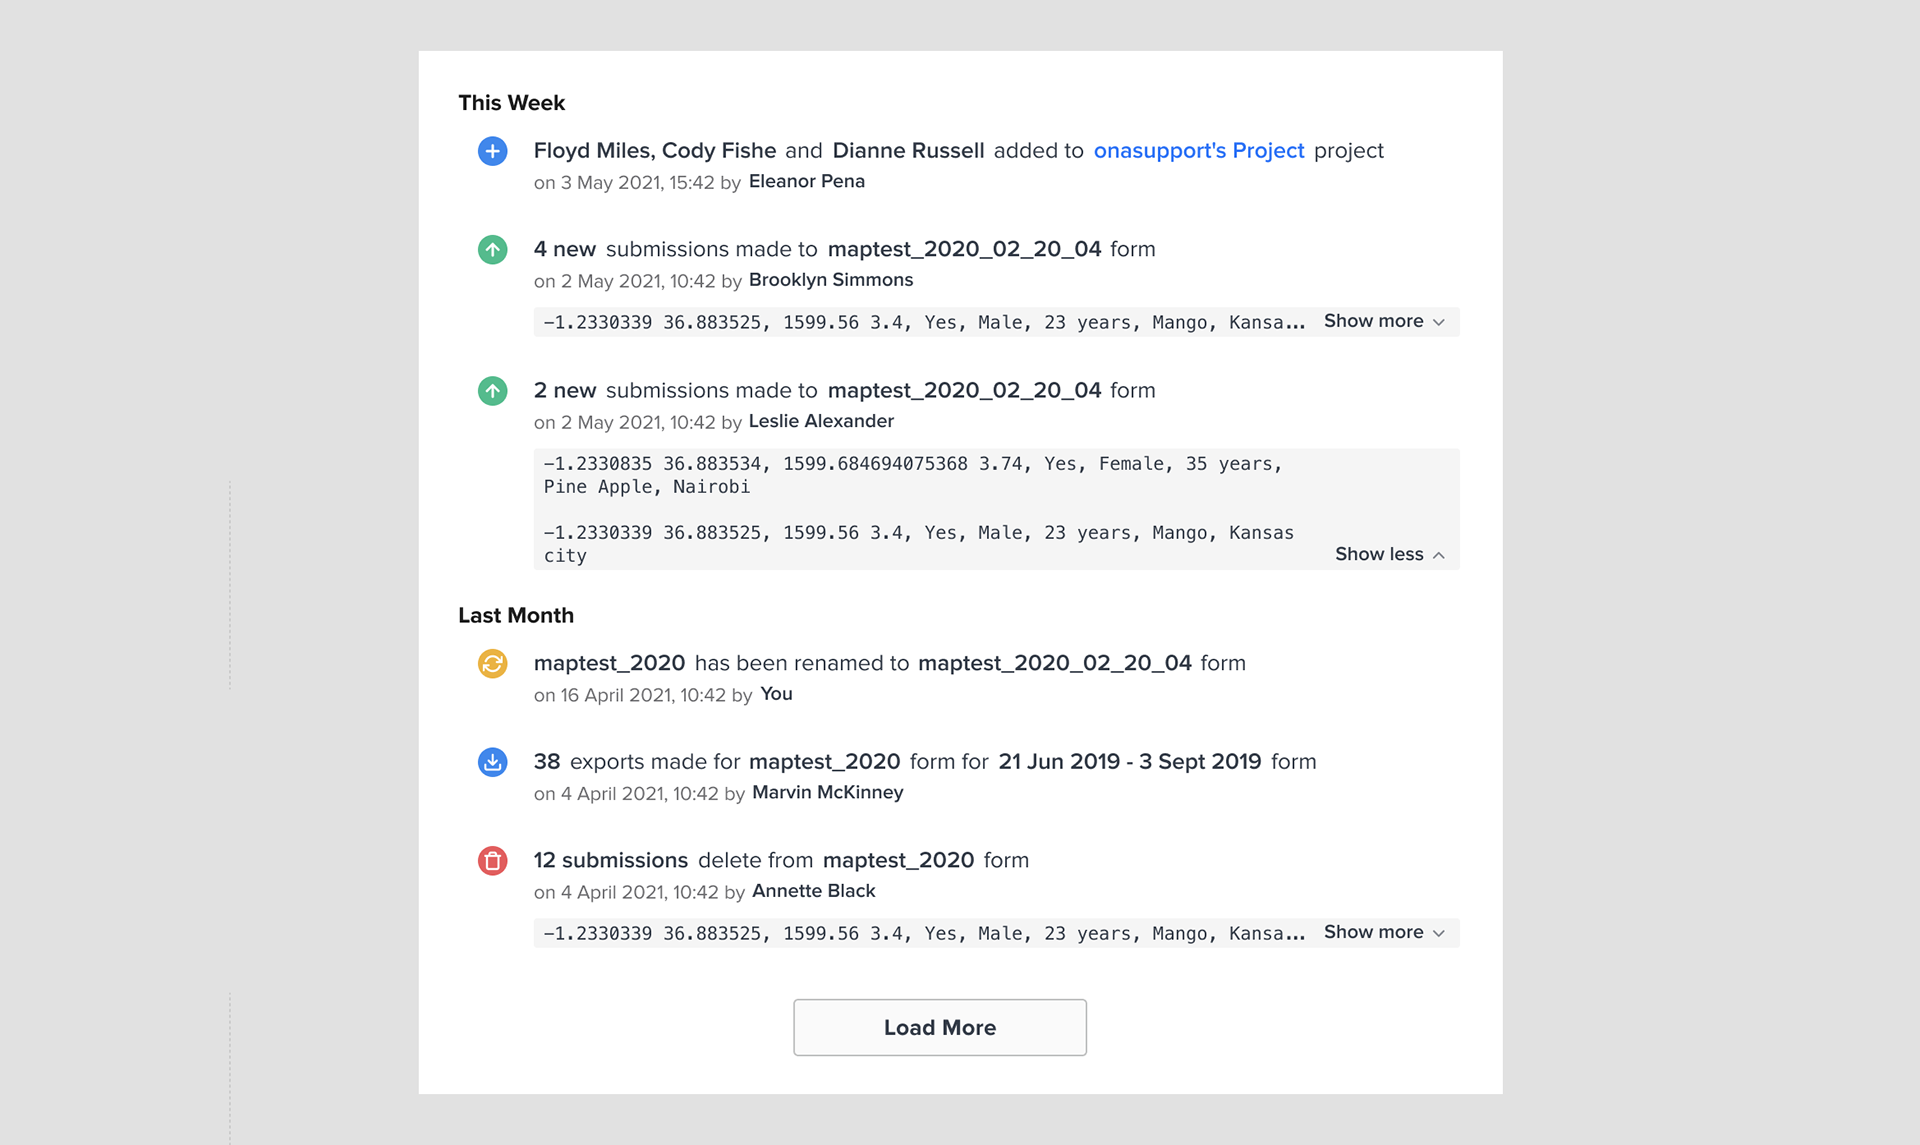
The activity log groups similar items and highlights data access and changes to the database. We decided what to show based on closely working with users through early prototyping.
Outcome
Our product discipline showed up in the business results: enterprise revenue and the account management and support function built around it both grew, and those relationships opened adjacent lines of business, including data visualization and custom training. Ona Data ARR has been consistent or grown since launch.
As of 2025, Ona Data accumulated 230M+ submissions and 580K+ forms since launch and been deployed enterprise-wide by UN organizations and global humanitarian partners. It's been used in almost every country in the world, supporting an array of vital impact projects, from helping countries eliminate polio and recover after devastating natural disasters.
Reflection
Ona Data wasn't a single-revenue-stream product, which is what made prioritization difficult. Beyond the standard tier for organizations running 10–20 projects, we supported enterprise clients running hundreds of projects across countries, an on-premise version for large enterprise clients, and large data-collection engagements tied to custom dashboards we built — all on a team small enough that most of its capacity went to maintaining what already existed, in a mature market with established competition.
The real conflict was between what would open new revenue and what would keep existing enterprise clients happy, knowing that every new feature meant ongoing cost, not just build effort. I resolved that by building a framework that weighed lifetime engineering cost against value to key users and revenue potential, which gave us a real basis for prioritization instead of the gut calls that had worked when we were smaller. We backed it with a standing group of engaged users we could go to for feedback before committing engineering time to it.
Role: Design Director and IC